AI-powered analytics for DHIS2
Ask questions about your data in everyday language. Get results, visualizations and insights in real time, powered by AI.
Conversational analytics for DHIS2
With the Convo app for DHIS2, you can ask questions about your data in natural language and have visualizations, tables and interpretations be created automatically using AI.
Intelligent visualizations
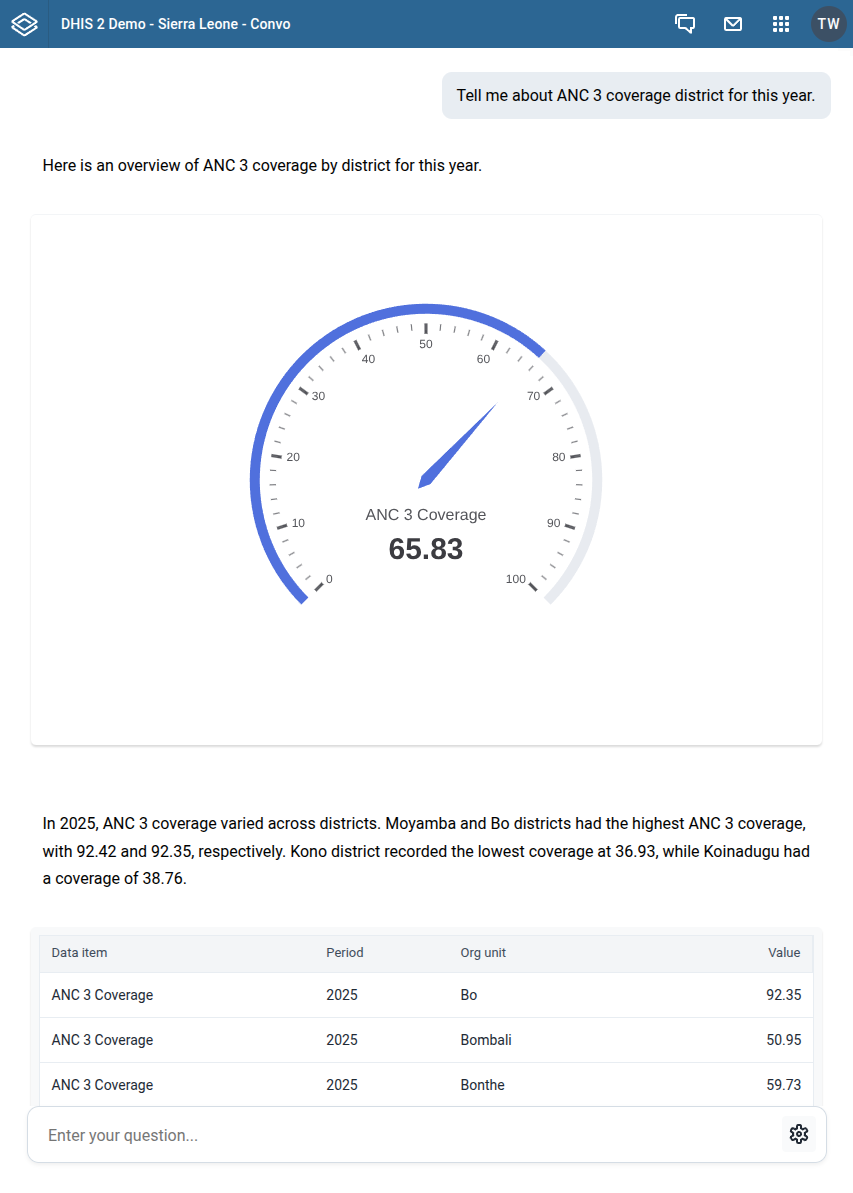
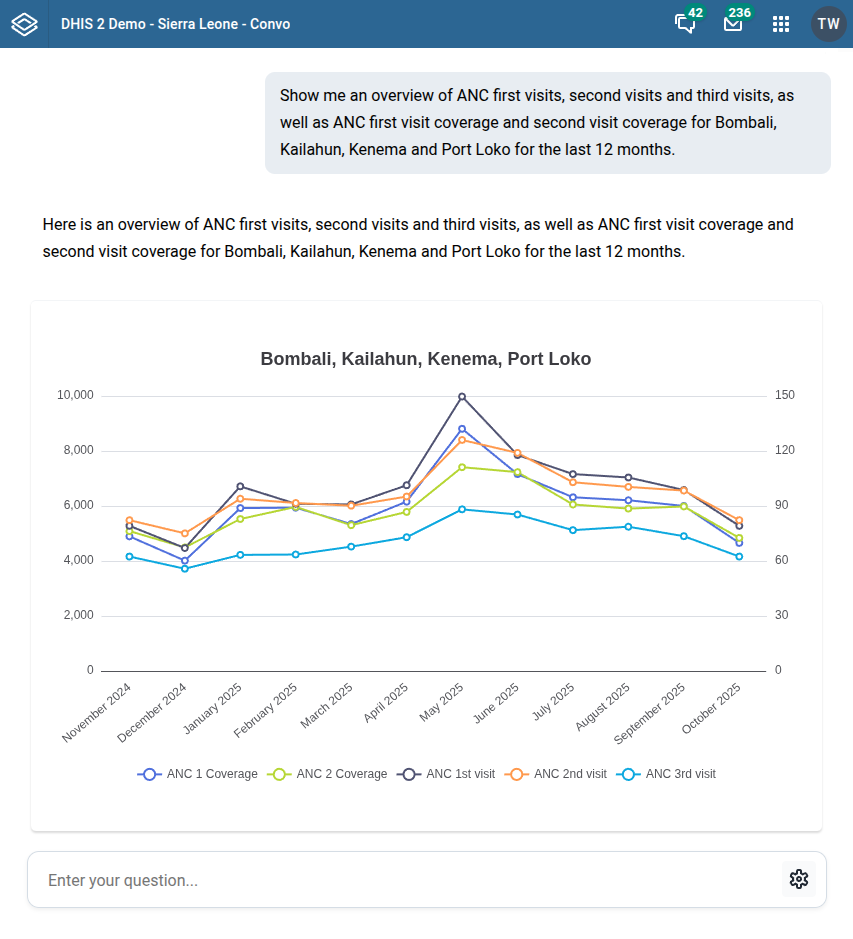
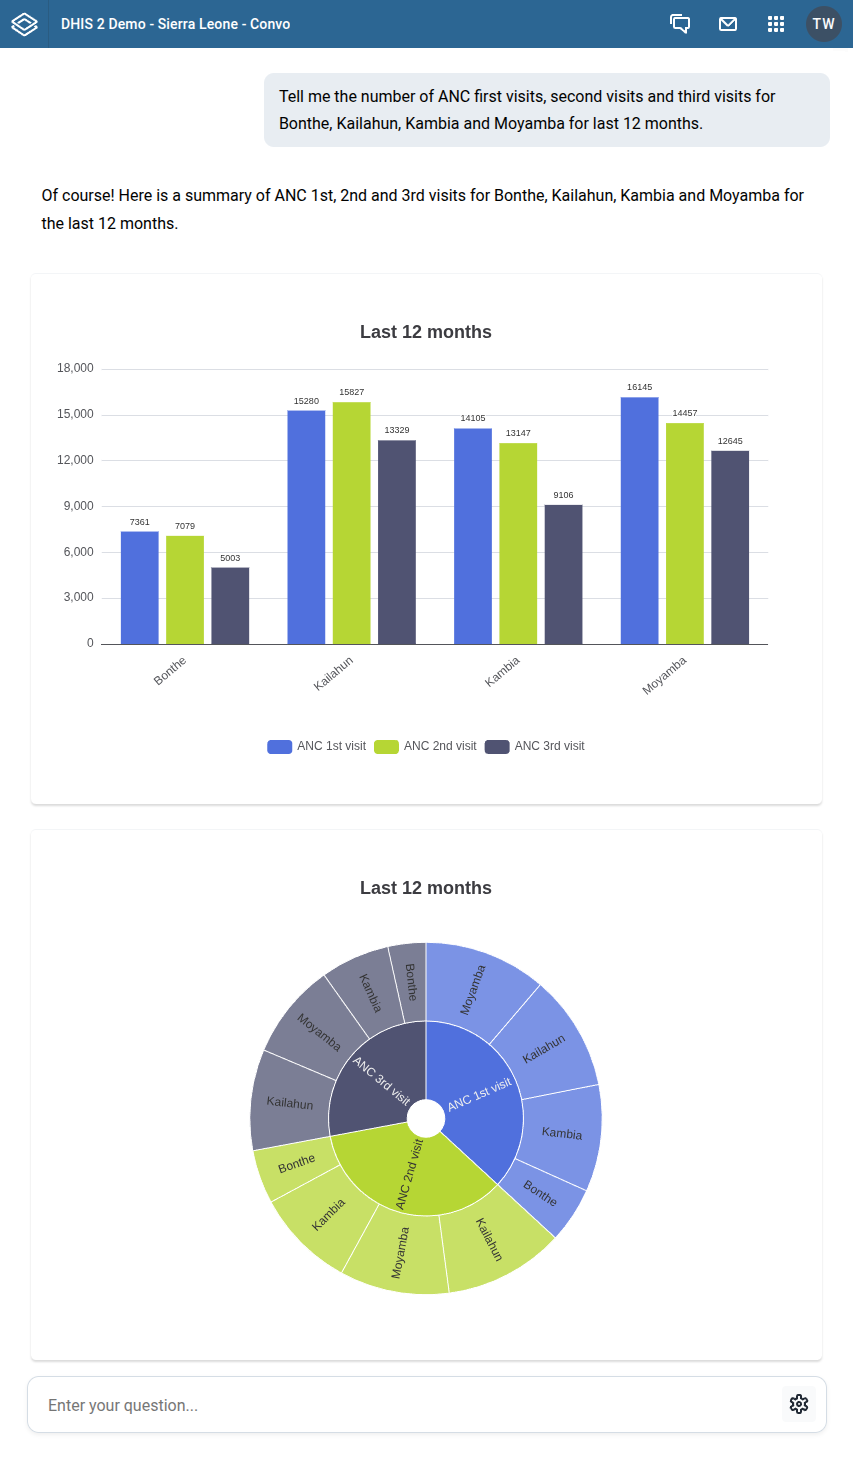
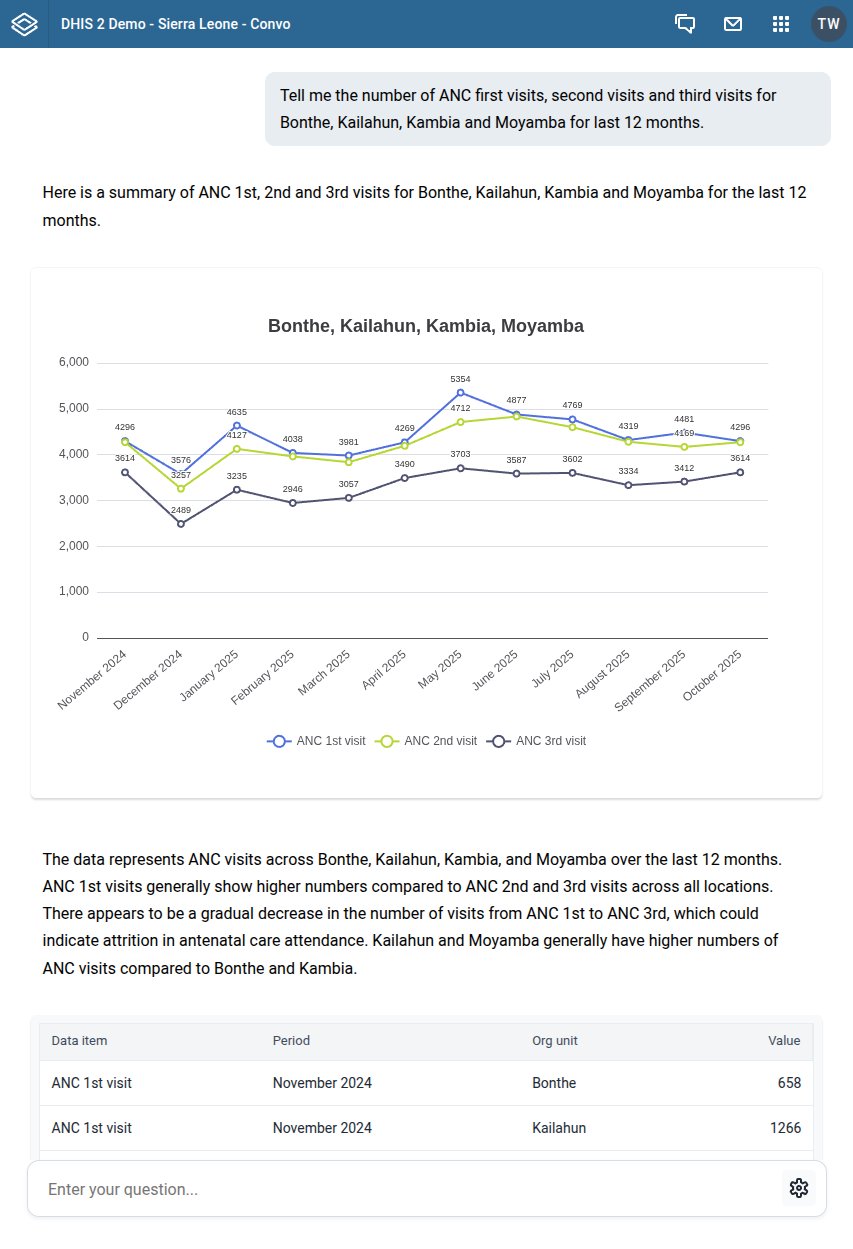
Visualizations are automatically designed, using line charts for time series data, bar charts for organisational unit comparison, sunburst and pie charts for categorical data and gauge charts for percentage-based indicators.
Data intepretations created with AI
With the Convo app, data interpretations are provided automatically, helping users to make sense of their data and take action.
On-demand dashboards
Information systems tend to get overloaded with dashboards, making it challenging for users to find the data they need. With conversational analytics and the Convo app, visualizations can be created instantly based on natural text questions, allowing users to get the data they need, when they need it.